
Cost And Production
Cost, in common usage, the monetary value of goods and services that producers and consumers purchase.
In a basic economic sense, cost is the measure of the alternative opportunities foregone in the choice of one good or activity over others.
This fundamental cost is usually referred to as opportunity cost.
Types of Costs
Fixed Costs (FC)
Variable Costs (VC)
Semi-Variable Cost
Total Costs (TC)
Marginal Costs
Opportunity Cost
Economic Cost.
Accounting Costs
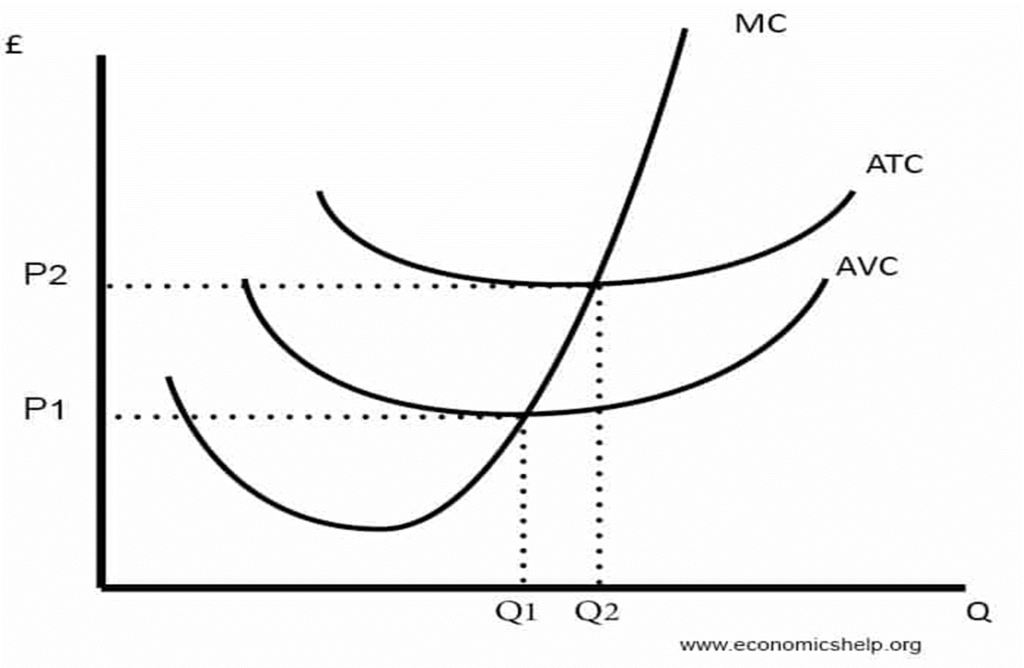
where Average Cost Curves
ATC (Average Total Cost) = Total Cost / quantity
AVC (Average Variable Cost) = Variable cost / quantity MC = Marginal cost.
AFC (Average Fixed Cost) = Fixed cost / quantity
Average Cost
Definition:
The Average Cost is the per unit cost of production obtained by dividing the total cost (TC) by the total output (Q).
By per unit cost of production, we mean that all the fixed and variable cost is taken into the consideration for calculating the average cost.
Thus, it is also called as Per Unit Total Cost
Symbolically, the average cost is expressed as:
AC = TC/Q
AC = Average Variable Cost (AVC) + Average Fixed cost (AFC)
Where,
Average Variable Cost = Total Variable Cost | Total output(Q) Average Fixed Cost = Total Fixed Cost | Total output(Q)
Marginal Cost
Marginal cost represents the incremental costs incurred when producing additional units of a good or service.
It is calculated by taking the total change in the cost of producing more goods and dividing that by the change in the number of goods produced.
Formula for Marginal Cost
The Marginal Cost Formula is:
Marginal Cost = (Change in Costs) / (Change in Quantity)
The Relation between the Average and Marginal Cost Curve
The relationship between the marginal cost and average cost is the same as that between any other marginal- average quantities.
When marginal cost is less than average cost, average cost falls and when marginal cost is greater than average cost, average cost rises.
(1) When AC Falls, MC is Lower than AC:
When average cost falls, marginal cost is less than AC. In Table 8, AC is falling till it becomes Rs.8, and MC remains less than Rs.8.
AC is falling till point E, and MC continues to be lower than AC.
In this case, marginal cost falls more rapidly than the average cost. That is why when marginal cost (MC) curve is falling, it is below the average cost (AC) curve.
(2) When AC Rises, MC is Greater than AC:
When average cost starts rising, marginal cost is greater than average cost.
When AC rises from Rs.8 to Rs.9, MC rises from Rs.8 to Rs.16. In Fig. 9, AC starts rising from point E. And, beyond E, MC is higher than AC.
(3) When AC does not Change, MC is Equal to AC:
When average cost does not change, then MC = AC. It happens when falling AC reaches its lowest point. At the 7th unit, average cost does not change.
It sticks to its minimum level of Rs.8. Here, marginal cost is also Rs.8.
MC curve is intersecting AC curve at its minimum point E.
Meaning of Cost Sheet:
Cost Sheet is a statement which presents detailed information relating to the various stages of cost.
It also shows the total cost of the product manufactured during a particular period of time.
Thus, the cost sheet is prepared for a particular period of time monthly, quarterly, yearly etc.
Objects of Preparing a Cost Sheet
The total cost and cost per unit of the product can be ascertained;
It helps the management to fix up the selling price on the basis of the cost per unit of the product after charging certain percentage of profit on cost;
It also helps the management presenting a comparative study of current cost with the existing cost per unit;
After proper comparison the management can take the corrective measures;
Method of Preparation of Cost Sheet:
Step I = Prime Cost = Direct Material + Direct Labour + Direct Expenses.
Step II = Works Cost = Prime Cost + Factory/Indirect Expenses.
Step III = Cost of Production = Works Cost + Office and Administration Expenses.
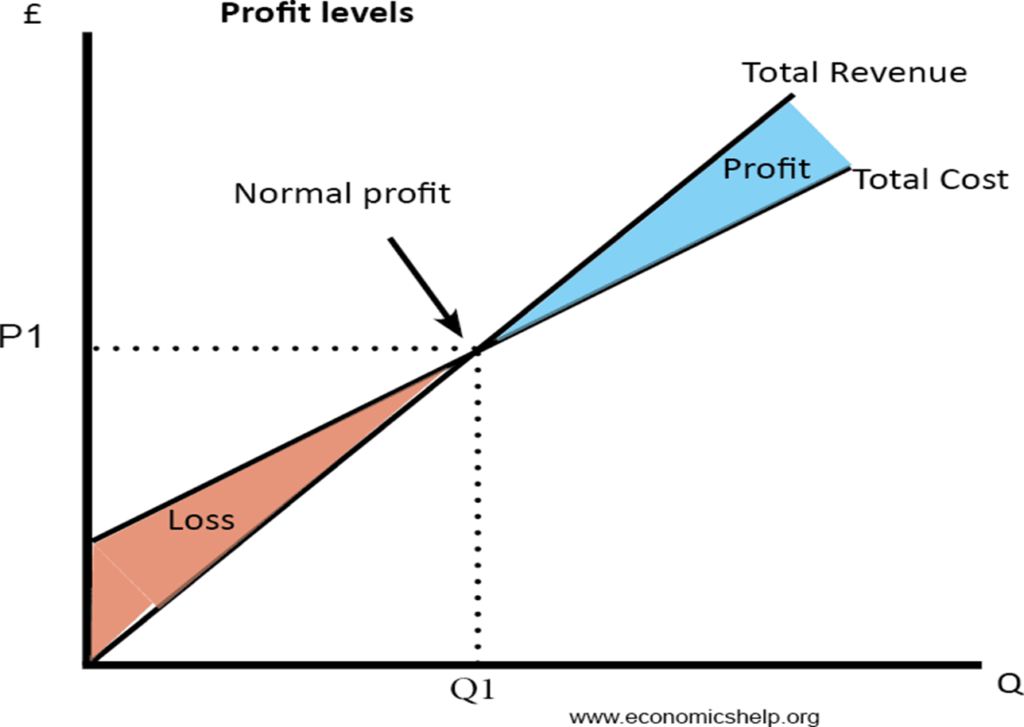
Step IV = Total Cost = Cost of Production + Selling and Distribution Expenses. Profit = Sales – Total Cost.
Unit Cost
A unit cost is a total expenditure incurred by a company to produce, store, and sell one unit of a particular product or service.
Unit costs are synonymous with cost of goods sold (COGS).
Unit cost is a crucial cost measure in the operational analysis of a company.
Identifying and analyzing a company’s unit costs is a quick way to check if a company is producing a product efficiently.
Accounting for Unit Costs
Private and public companies account for unit costs on their financial reporting statements.
All public companies use the generally accepted accounting principles (GAAP) accrual method of reporting.1 These businesses have the responsibility of recording unit costs at the time of production and matching them to revenues through revenue recognition.
As such, goods-centric companies will file unit costs as inventory on the balance sheet at product creation.
When the event of a sale occurs, unit costs will then be matched with revenue and reported on the income statement.
Production Function
To understand production and costs it is important to grasp the concept of the production function and understand the basics in mathematical terms.
We break down the short run and long run production functions based on variable and fixed factors.
Production function may be classified into two:
1)Short-run production function which is studied through Law of Variable Proportions
2)Long-run production function which is explained by Returns to Scale
Short-run production function –The law of variable proportions
The law examines the relationship between one variable factor and output, keeping the quantities of other factors fixed.
Definition
As the proportion of one factor in a combination of factors is increased, after a point, first the marginal and then the average product of that factor will diminish.
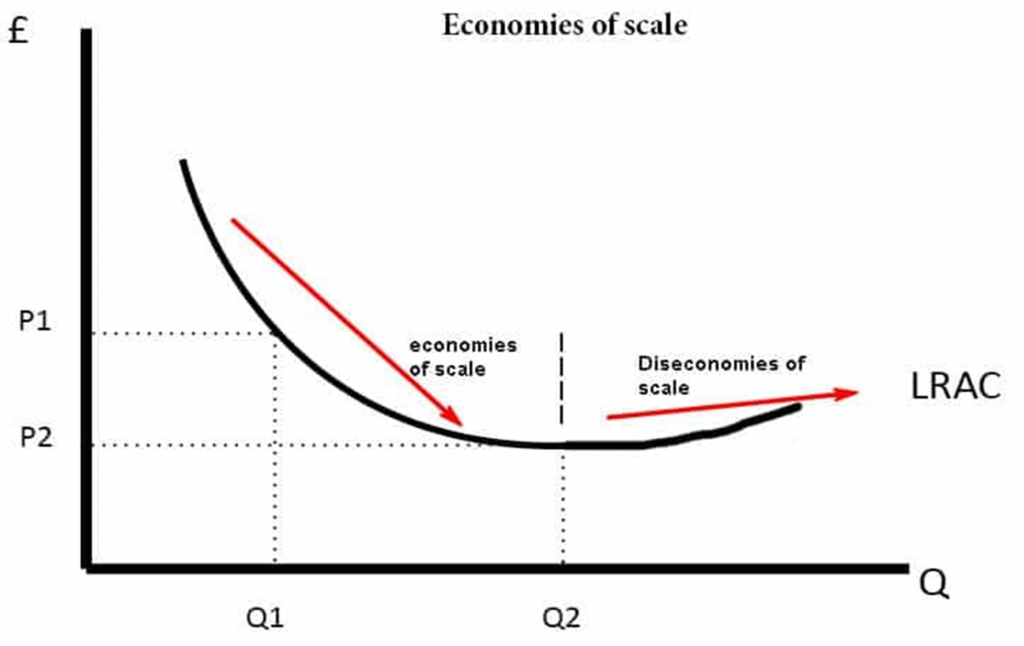
Long-run production function – Returns to Scale
In the long run, all factors can be changed. Returns to scale studies the changes in output when all factors or inputs are changed.
An increase in scale means that all inputs or factors are increased in the same proportion.